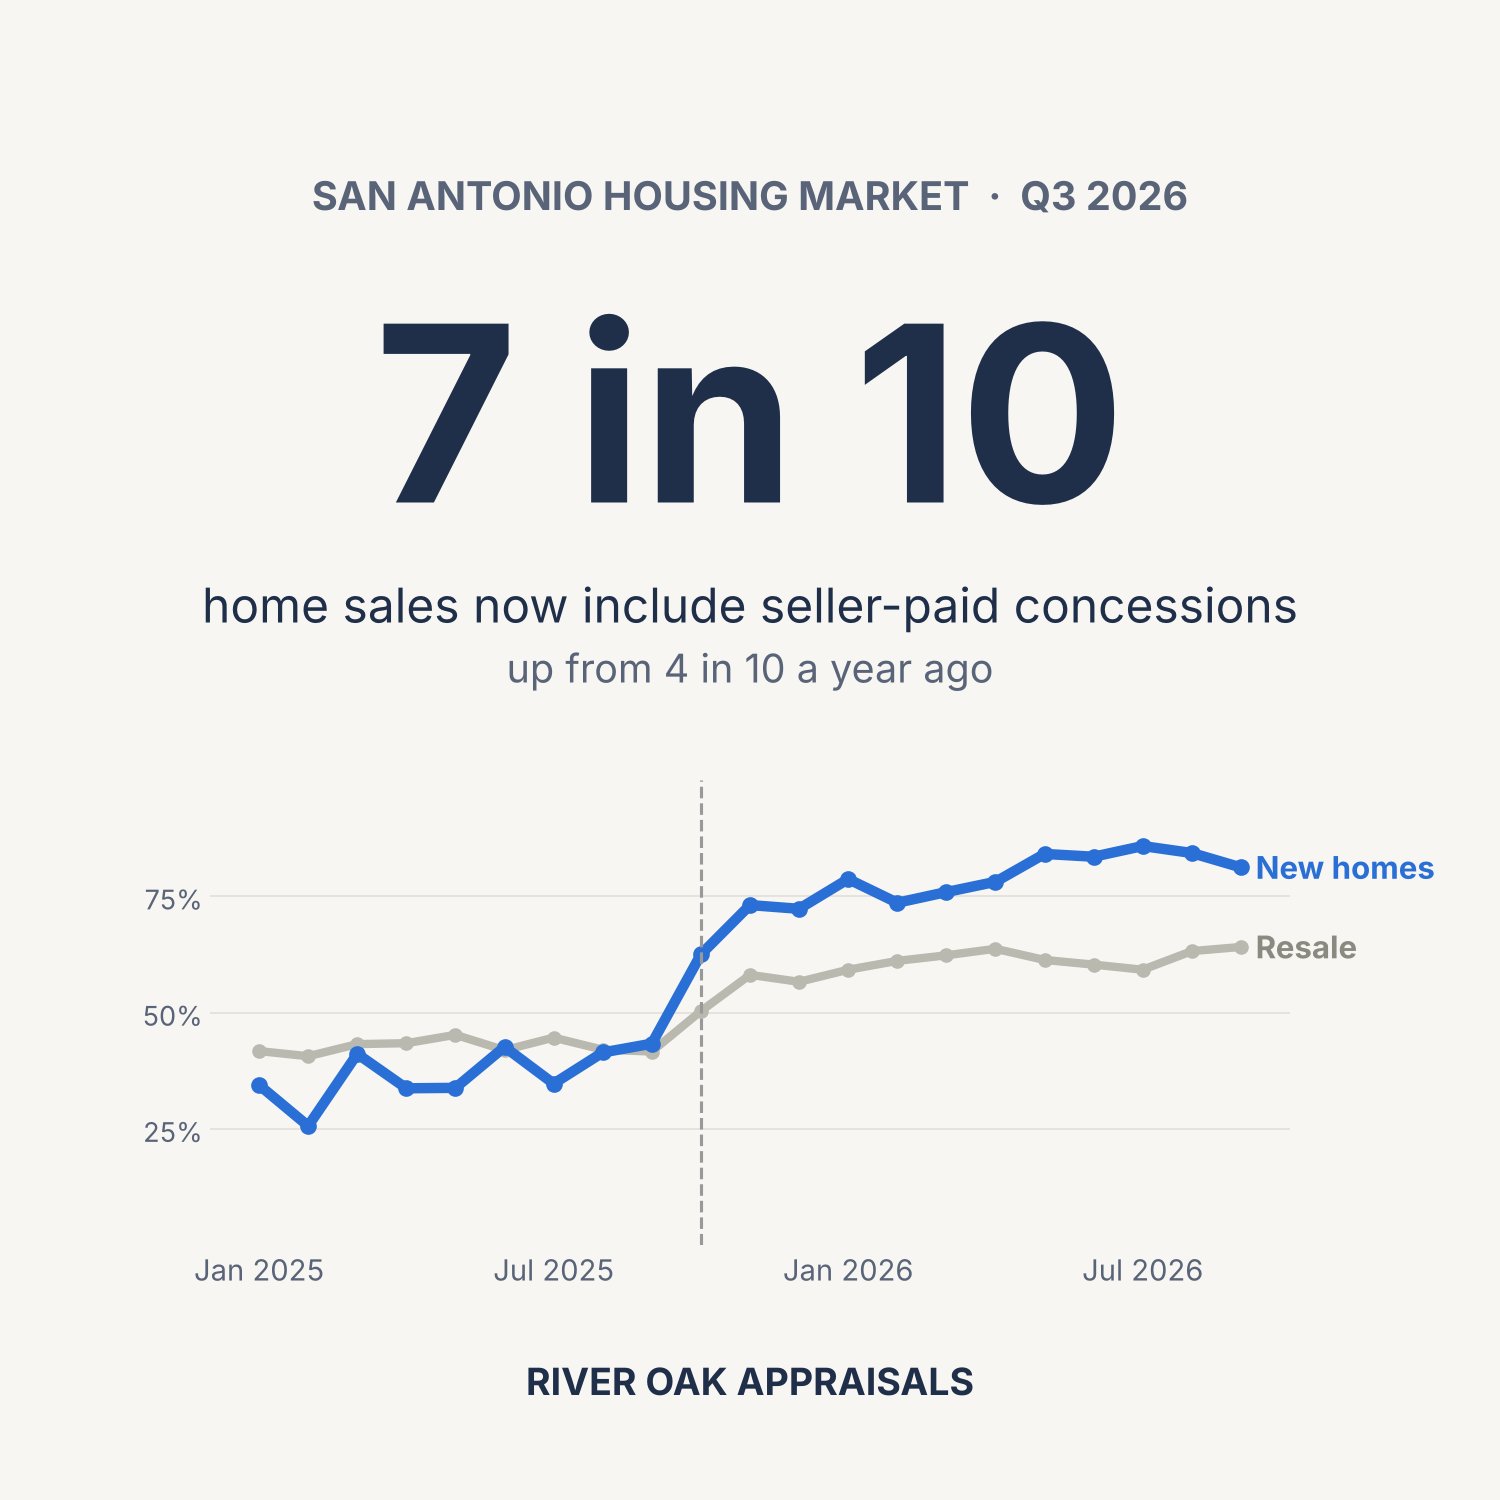
San Antonio Housing Market Q3 2026: 7 in 10 Sellers Are Now Helping Pay Buyers’ Costs
If you only looked at the median price, you would think nothing happened in San Antonio this summer. It was $309,000 a year ago. It was $308,000 this quarter.
But look at the closing statements and you see a different market. Seven out of ten sellers are now paying part of the buyer's costs. A year ago it was four out of ten.
We are appraisers. We read the contracts, the comps and the closing numbers on homes all over San Antonio every week. Every quarter, we pull every single-family sale from the MLS and break it down so you can see what is actually going on, not just the headline.
The short version:
Prices are flat, but the real price is lower. Concessions are doing the negotiating that used to happen on the sale price.
Builders are under the most pressure. New homes are taking 13 more days to sell, and 84% of them come with seller help.
Rates are going the wrong way. The 30-year rate hit 7.40% on October 8. Expect a slow fourth quarter.
The Numbers at a Glance
Single-family closed sales across the San Antonio MLS, July through September, this year vs last year:
Closed sales: 8,584, vs 8,599 (flat)
Median sale price: $308,000, vs $309,000 (flat)
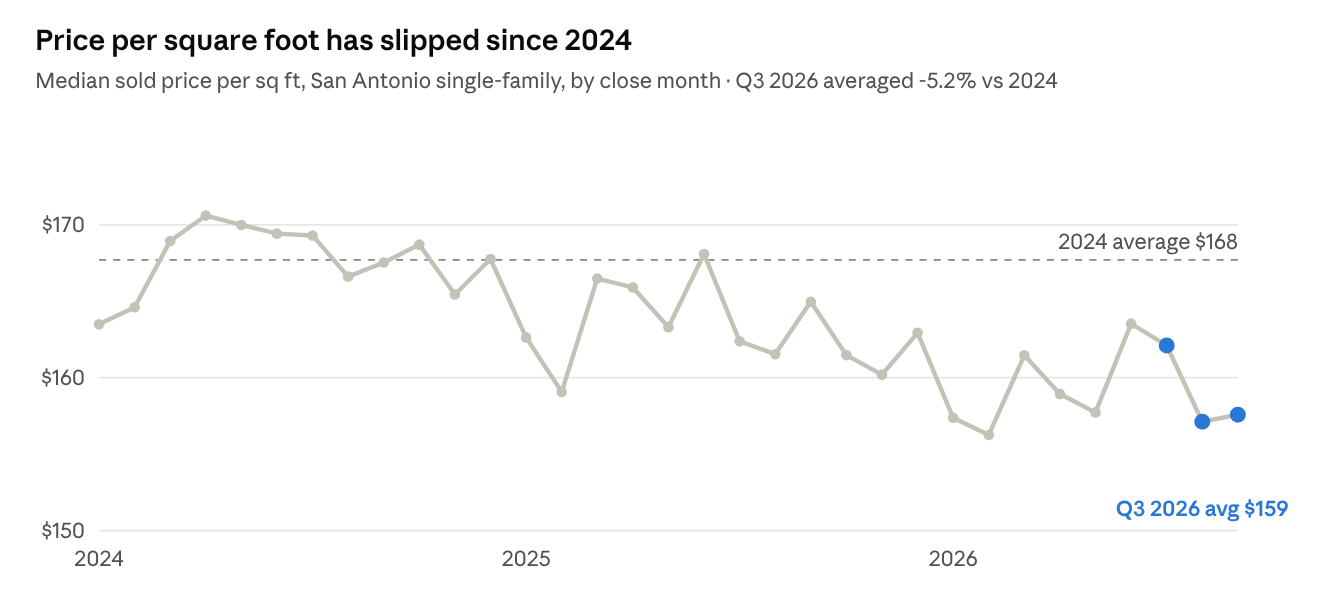
Median price per sq ft: $158.80, vs $162.80 (down 2.5%)
Median days on market: 66, vs 61
Sold price vs original list price: 94.7%, vs 94.5% (flat)
Sales with seller concessions: 71%, vs 42%
Median concession, when paid: $9,550, vs $8,000
Why is the median price flat while price per square foot is down? Buyers are getting slightly bigger houses for the same money. For tracking the overall market, price per square foot helps adjust for that shift in home size, and it has been drifting lower for two years.
SABOR's monthly reports line up with what we see. Sales were up 5% in July and 4% in August compared to last year, and inventory sat right around 6 months of supply. Six months is the line most people use for a balanced market. San Antonio is sitting right on it.
Concessions Are the Real Price Cut
This is the biggest change in the San Antonio market over the past year, and almost nobody is talking about it.
A year ago, about 4 in 10 sales had seller-paid concessions. This quarter it was 7 in 10. The typical amount grew from $8,000 to $9,550, roughly 3% of the price. And it did not creep up slowly. It jumped in October 2025 and has stayed there.
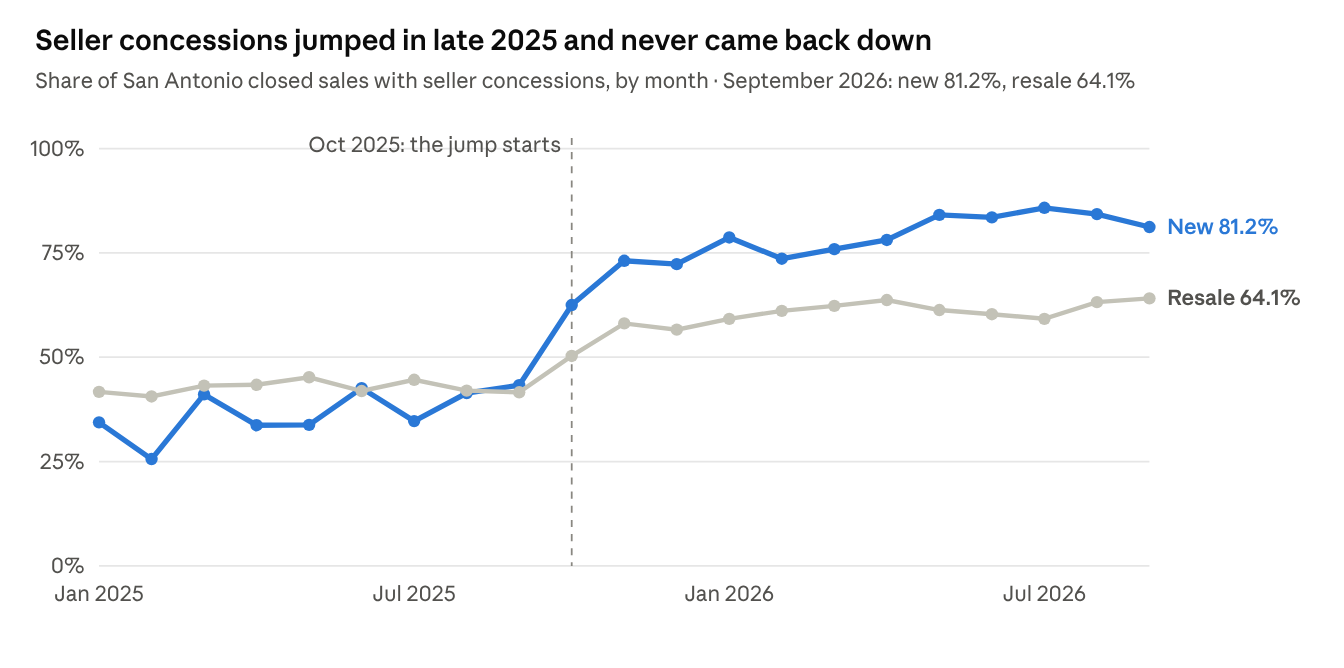
Builders moved first, going from 43% to 73% in two months as builders across the country rolled out big year-end incentives. Resale sellers followed, and neither group has backed off. (We checked whether the MLS changed how concessions are recorded. It did not. Same field, same export, before and after.)
From the appraiser's desk: A $310,000 sale with $10,000 in seller-paid costs is not the same as a $310,000 sale with none. But when most sales in a market include concessions, some seller help is simply part of the price buyers expect. So we measure what is typical in each market using the MLS data. Concessions up to that typical level are treated as normal, and we only adjust a comparable sale for the amount above it. With 7 in 10 sales now including concessions, "typical" has moved up, and that changes how every comparable sale gets read.
New Homes vs Resale: Two Different Markets
New construction made up 38% of all Q3 sales, the same as last year. But it is where the pressure shows:
Price per sq ft vs last year: new homes down 4.3%, resale down 1.1%
Median days on market: new homes 81 (was 68), resale 55 (unchanged)
Sales with concessions: new homes 84% (was 40%), resale 62% (was 43%)
Median concession: new homes $10,966, resale $7,689
Resale homes are holding up better than most people think: same days on market as last year, and only a small dip in price per square foot.
From the appraiser's desk: If you are selling an existing home near active builders, your real competition is a brand-new house with $10,000 or more in buyer help. Your buyer is making that comparison, and so is the appraiser. Pricing against the builder down the street, not just against last year's resale comps, is how homes are selling right now.
Your Part of Town
There is no such thing as one San Antonio market. Here is how price per square foot changed by school district, comparing this summer to last summer:
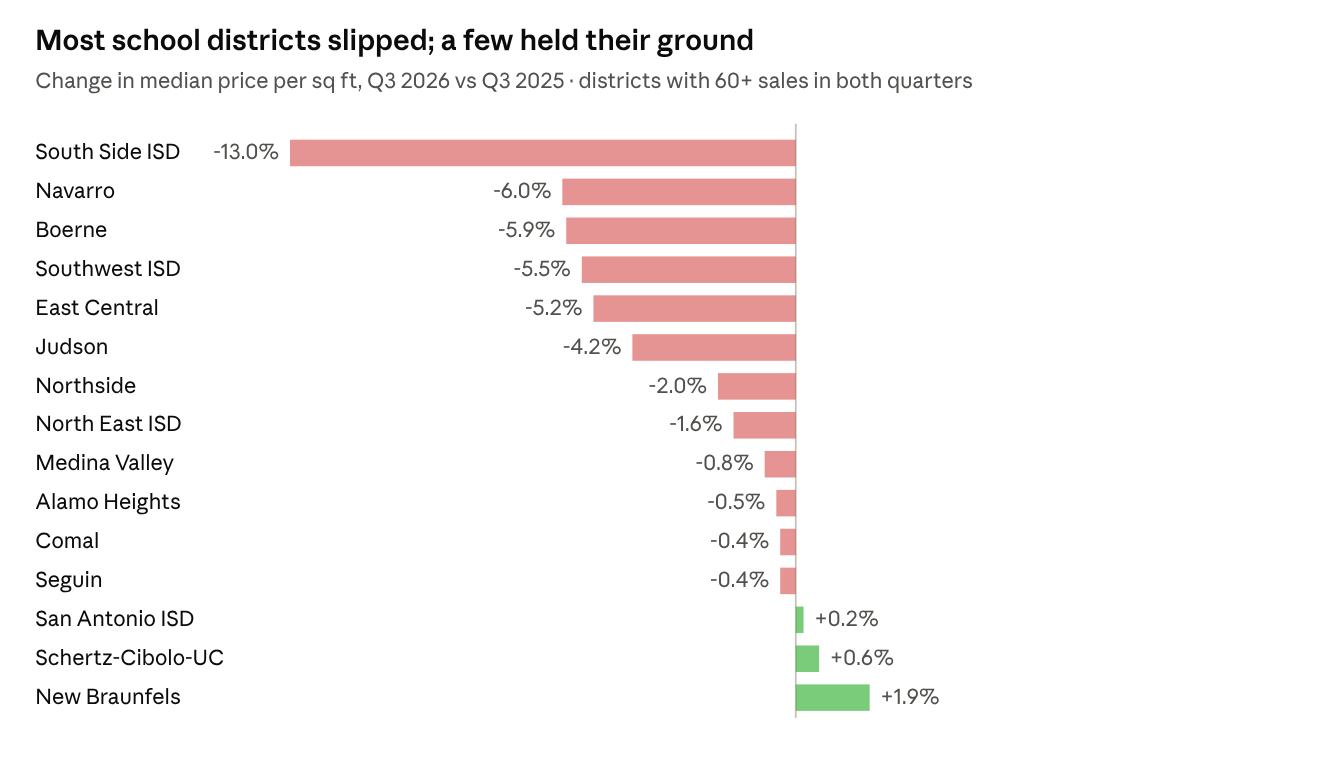
East Central is worth a closer look. Sales jumped from 491 to 697, mostly new construction, and that wave of builder inventory pulled values per square foot down.
A word of caution on ZIP code stats, because this one fools a lot of people. On paper, 78209 was up about 11% per square foot this quarter. But Alamo Heights ISD homes inside 78209 were only up about 1%. What changed was the mix: 78209 also includes North East ISD and San Antonio ISD neighborhoods that sell for far less per square foot, and this summer a bigger share of the ZIP's sales came from the Alamo Heights side. Same values, different mix, and suddenly the ZIP looks like it jumped.
That is why this report leads with school districts, and why a ZIP code with 50 to 100 sales a quarter should be read as a direction, not a precise measure. Want the real numbers for your neighborhood? Reach out and we will pull them.
By Price Range
Every price band had about the same number of sales as last year. The difference was time and concessions.
Under $200,000: days on market rose from 59 to 73, and the share of sales with concessions more than doubled.
$200,000 to $400,000: the heart of the market. Days on market up about 5, and roughly 3 in 4 sales had concessions.
$500,000 to $750,000: the steadiest band. Days on market actually dipped from 64 to 62.
$750,000 and up: slower, with days on market up from 68 to 72 and buyers paying about 97% of list.
Forecast Scorecard: How Did the Experts Do?
Every quarter we check last year's forecasts against what actually happened. It keeps everyone honest, including us.
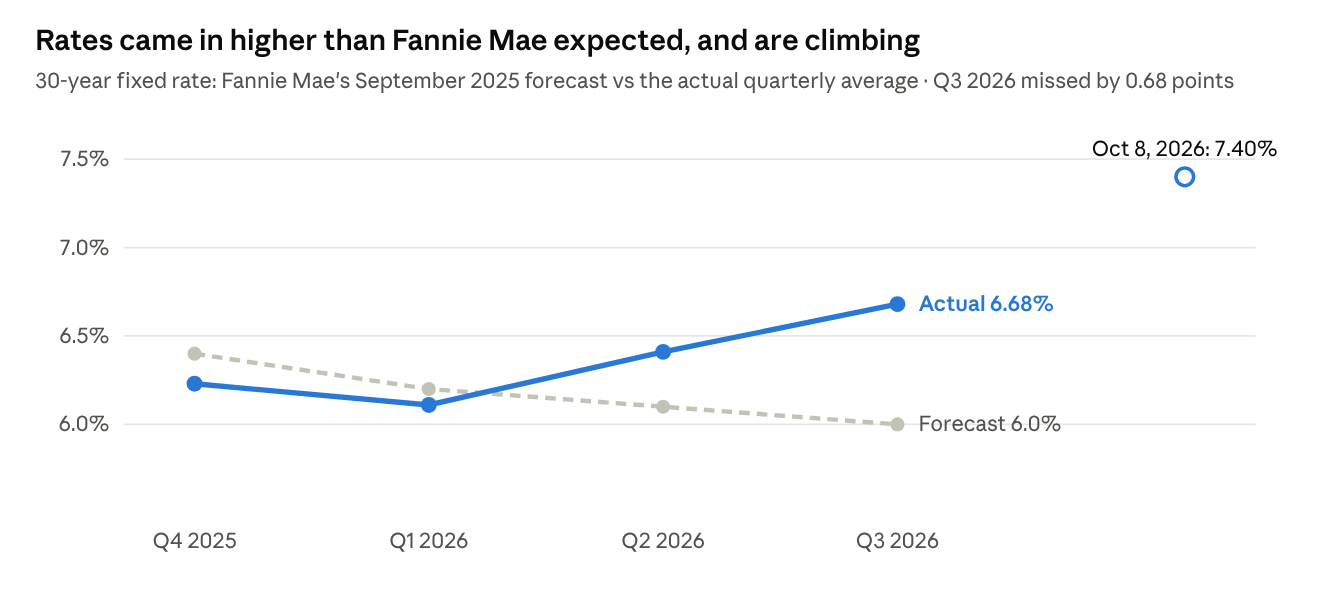
30-year mortgage rate, Q3 2026: Fannie Mae forecast 6.0% in September 2025. Actual average: 6.7%.
U.S. home sales pace, Q3 2026: forecast 5.24 million. Actual: about 4.63 million.
A year ago, Fannie Mae expected rates to drift down toward 6% and home sales to pick up by now. Neither happened. Rates came in almost 0.7 points higher, and sales stayed stuck near last year's pace.
Zillow's home value index for the San Antonio metro is down about 2% from a year ago and about 9% below its mid-2022 level. Zillow's current forecast calls for values to stay flat through the fall and slip about 0.7% over the next year.
What We're Watching for Q4
Mortgage rates are the story right now. The weekly Freddie Mac average crossed 7% in late September and was 7.40% on October 8. Fannie Mae's latest forecast, made before that jump, had rates in the 6.7% to 6.8% range through 2027.
Higher rates heading into the holidays usually means a slower fourth quarter. Our expectations:
Concessions stay high. At current rates, buyers need help with the payment, and builders and sellers will keep providing it.
Price per square foot stays flat to slightly softer, especially in areas with heavy new construction.
Well-priced homes still sell. Resale homes in established areas are holding up. Overpriced homes are the ones sitting.
What This Means for You
Selling? Price it right from day one, and expect to talk about concessions. If builders are nearby, they are your competition.
Buying? You have time and leverage, especially on new construction and on homes that have been sitting. Asking for help with closing costs or a rate buydown is normal right now.
Agents and lenders: Look past the median price. The concession line on the closing statement is where this market is really moving, and it is what the appraiser will be looking at too.
We will update all of this every quarter, keep score on the forecasts, and keep telling you what we see from the appraiser's side of the table.
Source: River Oak Appraisals analysis of single-family closed sales in the San Antonio MLS (connectMLS), July to September 2026 vs 2025, by close date. Also cited: SABOR monthly MLS reports (July and August 2026), Fannie Mae Housing Forecasts (September 2025 and September 2026), Freddie Mac Primary Mortgage Market Survey via FRED, and the Zillow Home Value Index and forecast. Figures are aggregates; no individual sales are reported.
Need a value for a specific property?
Divorce, estate, pre-listing or investment, we can help. Request a quote or call or text (210) 500-7880.